Please click the Go to Statistics button to find out our online analytics tool that will help you to explore participation of each country in the H2020 widening package.
How to read the statistics?
First, on a contour graph of Europe direct links will appear, linking countries in grant projects, while depicting participation versus the granted rate (Figure 1).
For example, one of eight participations have been granted with Switzerland, while ten out of 68 have with the United Kingdom. It should be noted that in several projects, more than one entity from one country take part.
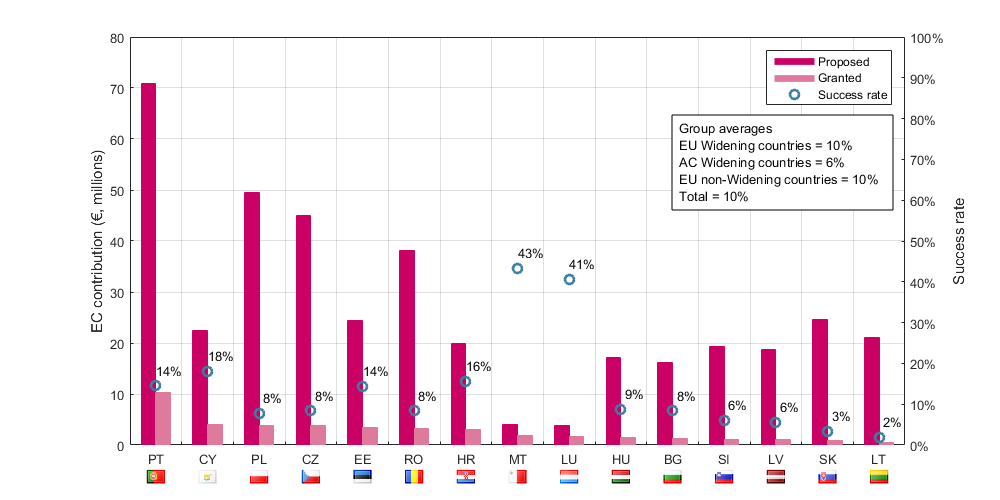
Pie and bar charts (Figure 2) show the proposed/granted and success rate statistics: as we can see, Portugal has secured an 11% share of the Twinning budget, the largest in the widening country group.
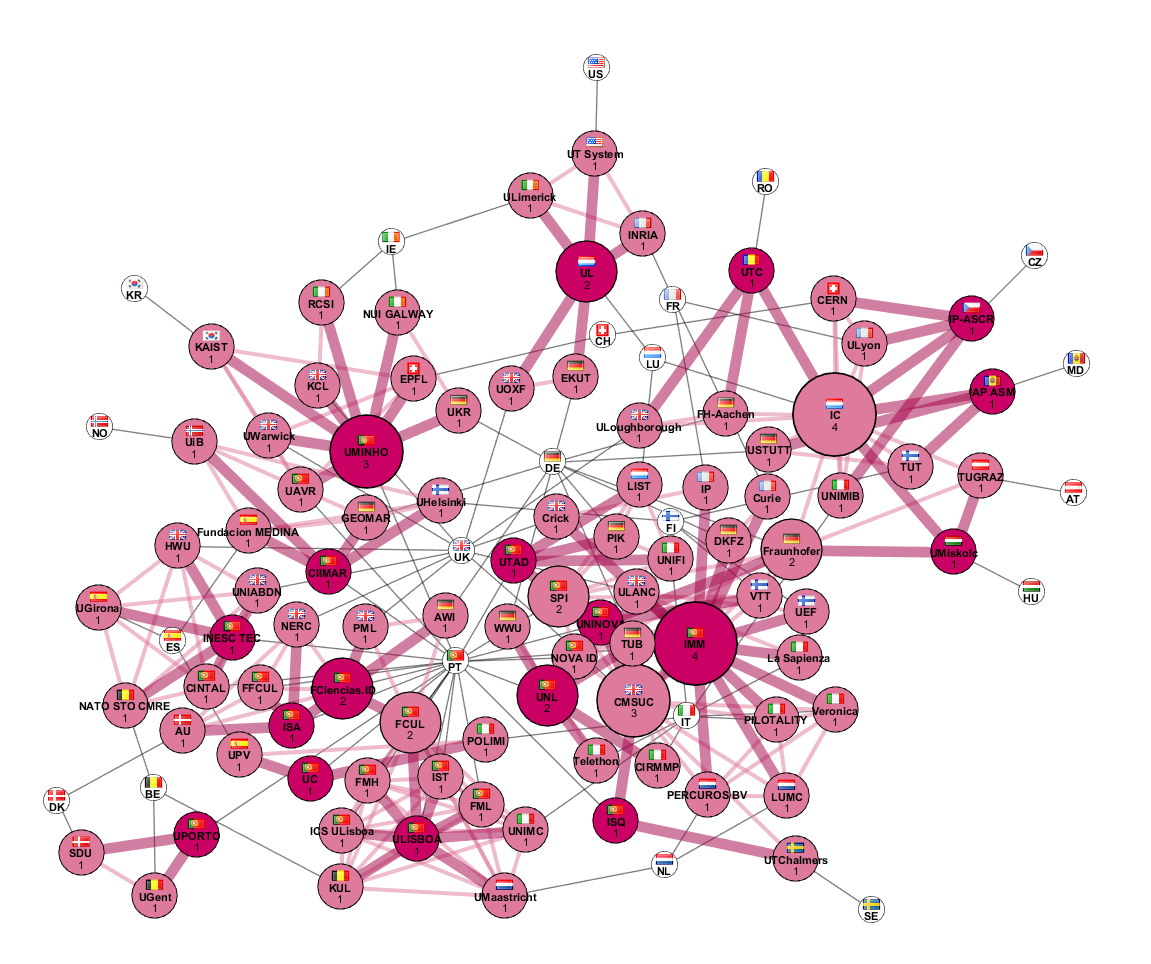
Finally, a network of Portuguese entities with advanced partners is revealed (Figure 3)
It should be noted that in a semi-regional network group Portugal and Luxembourg are grouped together in order to enhance regional analysis. The coordinators can be re-cognised by the colour of the partner organisation acronym.
Developed by Kaspars Kalnins, VIAA, NCP Latvia team